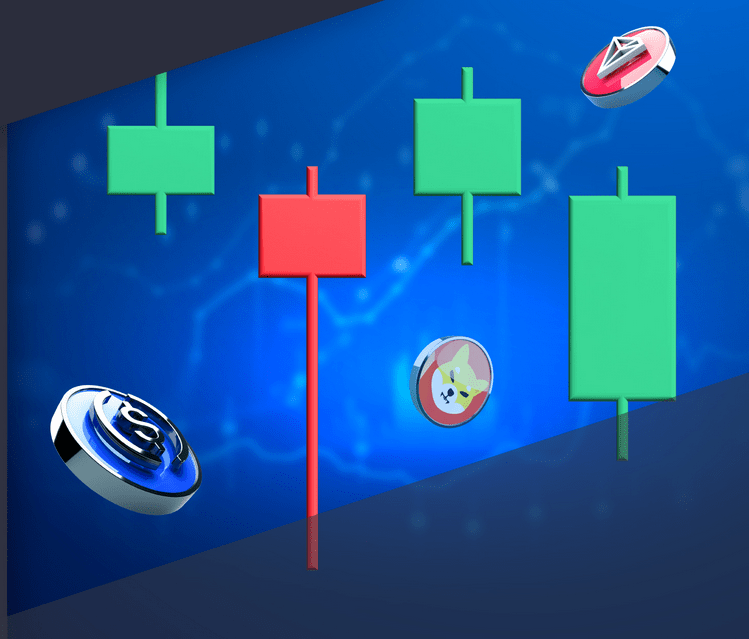
Technical analysis is one of the crucial aspects of a successful trading strategy. This technique helps to predict price fluctuations and make profitable deals based on this information. Successful research might require the use of different tools, including candlestick patterns. These instruments vary by their functions, so in this guide, we will pay particular attention to one specific type.
We are going to talk about hammer candlestick patterns. In this article, we will discover how one identifies various hammer candlestick patterns and use their core functions to one’s advantage. Actually, this type is one of the most popular ones because it helps traders who deal with different assets, including even digital currencies. With them, participants detect the reversals in value movements and the beginning of bearish or bullish trends by simply examining a look at the graphic. Even though the market and the instrument determine many outcomes, hammer candlesticks are believed to be quite accurate, especially if they are used in conjunction with other technical tools.
But this is just general information. To benefit from using hammer candlesticks, you should have a deeper knowledge of how to identify them and how to read different types of candles efficiently. Let’s explore everything step by step!
Getting started with hammer candlesticks
To begin with, take into account that this candlestick is the most frequently used category of charting after line graphs. In fact, in recent days, stock traders rely more on candlestick graphs because of their clarity and completeness. They bear the biggest amount of data and display it in quite a simple form. Even beginners can read them after learning and practicing for a while.
Considering that candlesticks are widespread, it won’t be a big deal to find a trading platform with this type of charting. However, you still should pay some time looking for companies that offer a lot of instruments for technical and fundamental analyses because a hammer candlestick pattern cannot be a 100% efficient system, even if you are aware of all the rules.
The second aspect that characterizes hammer candlestick patterns is their subdivision into different categories. Knowing the peculiarities of different hammer patterns, a participant is able to predict both bearish and bullish trends more accurately.
How do you predict bullish and bearish trends with hammer candlesticks?
In order to predict bullish and bearish price movements, you should know which hammer patterns indicate the start of upward/downward tendencies. Here is a simple guide to how you can identify the pattern visually:
Bullish patterns
- Hammer candlestick. If the closing price rises, the product’s value, this signal will appear on the chart. A basic signal has a short body and a long lower wick. The upper wick might be absent at all. It indicates positive trends for buyers, so it will be colored green or white.
- Inverted hammer candlestick signal. It happens when the trade might be closed at a higher value than it was opened. When it appears on the chart, it means that there was buying pressure, which should have caused the price to go up, but this didn’t happen before the candle closed.
Bearish hammer
Hanging man candlestick. When the closing price falls lower than the opening point, the hanging man appears on the graphic. It’s colored red. The hanging man candlestick shows that participants are active in selling the product. This long-body pattern warns traders about the expected beginning of the downgoing trend.
It isn’t perfect, but efficient.
Any charting is just an additional tool that helps to devise a plan for further actions. No one can guarantee that the advanced technical analysis with the use of hammer candlestick signals will become an ultimate panacea against financial losses. However, it’s still better to rely on additional tools, not only your intuition and analytical skills, to study the news from the markets. Hammer candlestick patterns are considered reliable because of the following characteristics:
- They bear big volumes of data in different financial markets, including exotic ones, such as the crypto market;
- It’s easy to identify trend reversals when working with hammer candlesticks;
- There are no limitations regarding timeframes, so you can use these tools no matter what trading style you prefer – day trading, swing trading, position trading, and so on.
We wouldn’t even mention the disadvantages if this signal was 100% accurate. Nevertheless, there are considerable reasons why hammer candlestick patterns might not be useful for you:
- Actual trend reversals in financial markets might depend on the news and context, which isn’t indicated on graphs – they show the behavior of traders that might not correspond to the determining market events;
- To make the most of the use of hammer candlestick patterns, you have to gain skills in using other advanced tools for technical analysis.
Conclusion
Never stop learning! The more trading tools you master, the more benefits you will have when trading online. We hope that this guide made you a step closer to understanding how the most widespread candlestick patterns work.


